
Stop Guessing Where ES & NQ Will Reverse:
How Dealer Gamma Levels Dictate Intraday Price Action
Retail indicators show where price has already been. Dealer gamma exposure reveals where institutions are forced to react. Here is the master breakdown of 0DTE delta hedging mechanics and the 3 daily setups that professional day traders look for every single session.
The 6 Unfair Advantages of Trading With Gamma Levels
Short on time? Here is why professional index futures day traders trade with options dealer hedging physics instead of subjective, lagging retail chart patterns.
Stop being liquidity for Wall Street. Know where billions in institutional hedging will forcefully halt, reverse, or accelerate price before you enter.
Multi-billion dollar option dealers must stay delta-neutral. When price hits a Call or Put Wall, dealers are legally and mechanically forced to hedge billions in underlying futures.
Never get caught buying the exact high of a "breakout" candle that violently reverses and stops you out 2 minutes later.
In Positive Gamma, dealer hedging absorbs momentum. When retail FOMO buys into a Call Wall, dealers are heavily selling. You fade the retail trap with high-probability precision.
Zero second-guessing. You have exact institutional take-profit levels (Target 1, Target 2) and invalidation stops mapped before the opening bell.
Institutions do not manage billions with moving averages. Price naturally gravitates and pins to Call Walls, Put Walls, and the 0DTE Price Magnet where maximum options value sits.
Know within seconds whether today is an easy range-bound scalp market or a massive multi-hour trend day that can make your entire month.
The Gamma Flip line is your volatility compass. Above the flip, dealer hedging stabilizes price (fade walls). Below the flip, dealers hedge with momentum, sparking cascading flushes and runners.
Never get blindsided mid-session. When institutional whales relocate billions of dollars, you see the walls shift live on your chart in real time.
Our rolling shift engine detects wall changes instantly. If the Call Wall suddenly jumps up 30 points at 11:00 AM, institutions lifted the ceiling to allow higher prices. You ride the wave.
100% focused on execution—zero mental math, zero manual conversions between SPX/NDX cash indices and your futures charts.
95%+ of global index gamma resides in Cboe options, but futures trade with a basis spread while ETFs track spot. Our synchronized parity engine calculates the basis live for futures and streams calibrated direct levels onto ES, NQ, SPY, QQQ, SPX, and NDX charts.
Why the Options Market Moves Index Futures
Most retail day traders only stare at the futures chart: moving averages, RSI, chart patterns, and horizontal support/resistance lines. While helpful, this is only half the picture.
Every single day, institutions, pension funds, hedge funds, and retail speculators trade billions of dollars worth of S&P 500 (SPX) and Nasdaq 100 (NDX) options. When you buy a call or put option, you rarely trade against another retail trader. You trade against an options dealer (market maker) at a firm like Citadel Securities, Jane Street, or Susquehanna.
Dealers do not gamble on market direction. Their business model is capturing the bid-ask spread while remaining delta-neutral. If a dealer sells you a call option, they are now short market risk. To eliminate that risk, the dealer immediately enters the CME futures market and buys or sells ES E-mini or NQ Nasdaq futures contracts. If you trade funded evaluation accounts, these institutional hedging flows are critical for protecting trailing drawdowns—see our Prop Firm Trading Guide.

A sportsbook bookmaker takes bets on a championship football match, but does not care who wins. If too much money pours into Team A, the bookmaker hedges his book across other betting exchanges to balance the risk. Options dealers do the exact same thing with index futures: their rebalancing hedges are massive, completely mechanical, and occur at mathematically predictable price levels.
You do not need to trade options. You use options positioning as high-resolution intelligence to trade index futures with unfair precision.
Delta & Gamma in Plain Words
To understand why price stalls at certain levels, you only need to understand two Greeks:
1. Delta = Directional Exposure (Speed): Delta tells you how much an option's value changes when the underlying market moves by 1 point. For a dealer, delta represents their live directional exposure—how many futures contracts they must hold right now to stay neutral.
2. Gamma = The Rate of Change (Acceleration): Delta is not static. When the market moves, delta changes. The dealer's existing futures hedge is suddenly out of balance, forcing them to buy or sell additional futures. Gamma measures how violently delta changes for every 1-point move in the market.
Think of a car on the highway. Delta is your current speed (60 mph). Gamma is how hard you press the accelerator pedal: how rapidly your speed changes. A dealer holding heavy gamma is like a driver who must slam the gas and tap the brake every few seconds just to stay in the lane.
0DTE & The First Two Hours of the Session
In recent years, the market underwent a seismic shift: the introduction of 0DTE (Zero Days to Expiration) options that expire on the very same day. Today, 0DTE options account for over 50% of all SPX options volume.
In options mathematics (the Black-Scholes formula), as time to expiration shrinks toward zero (\(T \to 0\)), gamma approaches near-infinity at strikes close to the money. A tiny 3-point fluctuation in the index forces market makers to frantically adjust hundreds or thousands of E-mini futures contracts.

The First Two Hours
Institutional volume and liquidity are concentrated between 9:30 AM and 11:30 AM ET. This is when new 0DTE positions are established and dealers must execute their largest hedges.
Fresh Positioning
Levels are cleanest during the morning session. Reactions at key barriers are sharp and provide the most asymmetric risk-to-reward ratios (frequently 8R to 10R).
Where the Data Comes From
Traders frequently ask: "Where does this data come from, and how is it calculated?"
The calculation pipeline requires ingesting live institutional options chains and running multi-step quantitative models in real time.
Our high-speed cloud infrastructure continuously ingests real-time institutional options data, calculates total dealer gamma exposure across every active strike, and dynamically recalibrates the live mathematical basis between cash indices and CME futures (ES & NQ). The resulting institutional support and resistance barriers are streamed directly into your NinjaTrader 8 chart with zero lag and zero manual calculation required.
Unlike static morning cheat sheets or daily PDF pivots that become obsolete within the first hour of trading, Gamma Wall auto-updates dynamically throughout the entire trading session. As institutional options volume flows in and dealer delta exposure shifts midday, your NinjaTrader 8 levels adjust automatically in real time—with zero manual inputs, zero typing, and zero chart reloading.
The 4 Key Levels Every Futures Trader Must Watch
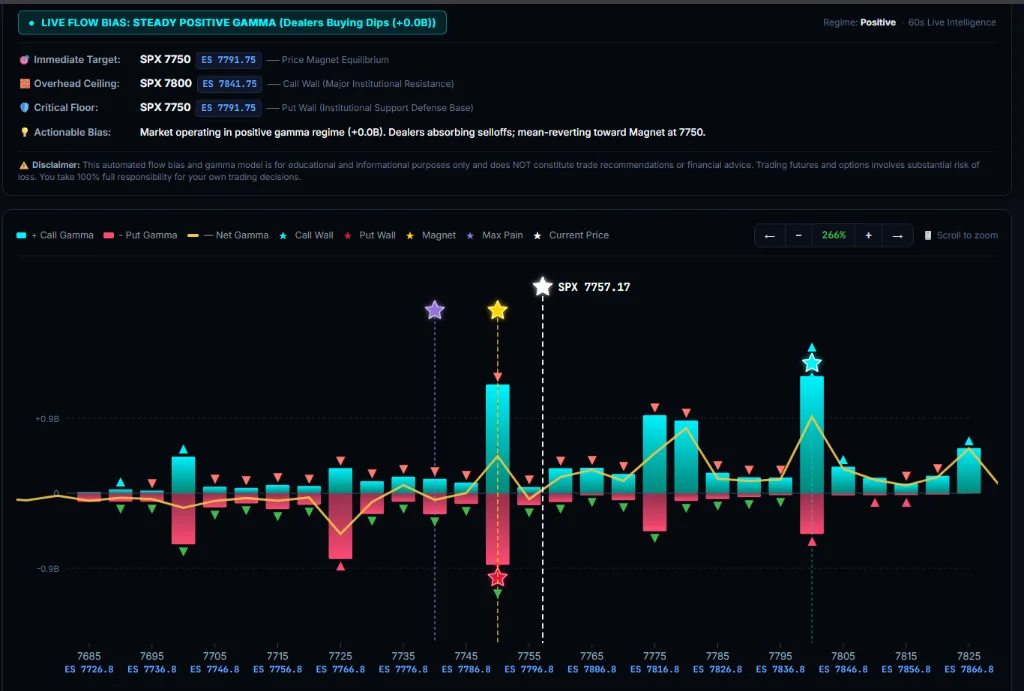
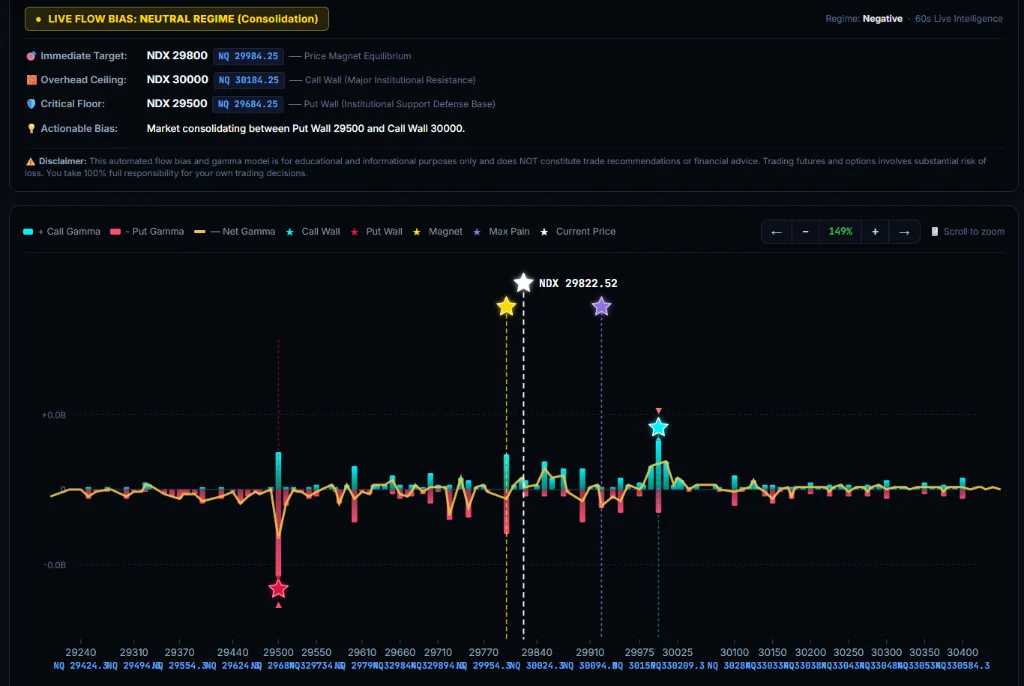
When you sum the gamma exposure of every strike, a clear structural map of the market emerges. Four critical boundaries dictate intraday price action:

1. The Call Wall
The strike with the largest positive gamma concentration. As price rallies toward this strike, market makers are forced to sell index futures to hedge, dampening upside momentum.
2. The Put Wall
The strike with the largest negative gamma concentration. As price plummets into this strike, dealers are forced to buy index futures to cover delta, creating aggressive upward bouncing.
3. Zero Gamma (Gamma Flip)
The exact inflection price where net dealer gamma crosses from positive to negative. It separates two completely different market environments.
4. Price Magnet & Max Pain
The multi-factor strike with the heaviest total open interest and absolute gamma concentration. Due to options pin risk, dealers are pulled toward this strike near the close.
Calm Days vs. Fast Days: The Two Market Regimes
Before placing any trade, professional traders ask one fundamental question: "Is price trading above or below Zero Gamma?"

The Positive Gamma Environment: The Shock Absorbers
When price is above Zero Gamma, dealers are long gamma. Their mechanical hedging rule is: sell when the market rises, buy when the market falls. This dealer flow acts as an enormous shock absorber, deadening volatility and suppressing breakout attempts.
Market Personality
Candle Characteristic
Dealer Hedging Flow
Recommended Playbook
The Negative Gamma Environment: Pushing a Rolling Car
When price falls below Zero Gamma, dealers flip to short gamma. Their mechanical hedging rule completely inverts: they must sell more futures as the market drops, and buy futures as the market rallies. Dealer hedging no longer dampens moves—it actively fuels and accelerates them.
Market Personality
Candle Characteristic
Dealer Hedging Flow
Recommended Playbook
The 3 Setups You Can Trade Every Single Day
A gamma level alone is never a trade signal. Entering blindly just because a level exists is a recipe for losses. Instead, we observe how price approaches the level and execute one of three disciplined setups:

The Wall Fade (Slow Approach)
The Scenario: You watch price slowly grind down all morning. Retail is hesitant to buy because the chart looks weak. But you see the Put Wall sitting right below, where institutional dealers are mathematically obligated to buy futures to maintain delta-neutrality. You enter with defined risk right where the selling dries up.
This setup is designed for Positive Gamma regimes when price slowly drifts into the Put Wall or Call Wall with small candles and declining momentum.

Execution Process
- Locate: Confirm market is in Positive Gamma and price is drifting into the Put Wall (or Call Wall).
- Approach: Ensure approach is slow (small candles, no panic).
- Confirmation: Look for absorption on order flow (heavy market sell volume absorbed without price breaking lower).
- Trigger: Enter on rejection candle close or delta flip from negative to positive.
The Fast Overshoot & Reclaim (Trapped Breakout)
The Scenario: A giant green candle blows through the high of the day. Retail traders pile in with aggressive FOMO, thinking it's a runaway breakout. Ten minutes later, price rejects, printing a long wick that traps everyone who bought the top. Instead of being the victim, you wait for the reclaim and ride the flush of their liquidation.
When the market approaches a major Call or Put Wall with aggressive, fast momentum candles, do not step in front of the train. Price frequently overshoots the level temporarily to hunt stop-run liquidity before failing.

Execution Process
- Watch the Overshoot: Allow price to poke through the Call Wall (or Put Wall) by 5–15 points.
- Identify Trapped Traders: Retail breakout buyers rush in at the highs, but volume stalls with no follow-through.
- The Failure: Sellers step in and aggressively push price back under the Call Wall line.
- Trigger: Enter short immediately upon the candle closing back inside (reclaiming) the level.
The Zero Gamma Regime Flip
The Scenario: Every trader has experienced days where every support level gets sliced through like butter, and buying the dip repeatedly blows accounts. That happens because the market flipped below Zero Gamma—turning dealers into aggressive sellers. Once you spot this flip, you stop fighting the market and ride the multi-hour institutional trend.
Unlike the first two setups, this does not fade a wall. It trades the exact moment the market shifts personality from calm chop into high-velocity trend rapids.

Execution Process
- Setup: Price consolidates near the Zero Gamma flip line late morning while net GEX rapidly contracts.
- Break: A high-volume candle breaks decisively through Zero Gamma with expanding candle range.
- Retest: Price retests the broken Zero Gamma level from below, treating it as new resistance.
- Trigger: Enter on rejection of the retest, riding the acceleration of negative dealer delta hedging.
Imagine Opening NinjaTrader and Already Having a Plan
Before the opening bell rings, your institutional boundaries are already mapped automatically onto your charts. Instead of scrolling social feeds for trade ideas, drawing ten subjective trendlines, or anxiously second-guessing every 1-minute candle, you know the exact battlefield in advance:
1. The Intraday Regime
You know immediately whether the day favors calm mean-reversion fades (Positive Gamma) or violent cascading breakout runners (Negative Gamma).
2. The Structural Boundaries
You see exactly where multi-billion dollar institutional options hedging will act as elastic support (Put Wall) or overhead resistance (Call Wall).
3. Objective Asymmetric Geometry
Your take-profit targets (Price Magnet) and invalidation stops are concrete before you enter—never decided in emotional panic mid-trade.
Less second-guessing. Zero emotional chasing. Just disciplined, objective execution alongside the largest liquidity providers in the world.
The Triple-Stack Edge & Pre-Session Checklist
Consistent profitability comes from stacking high-conviction factors together:
Location
The Gamma Wall tells you WHERE to look. Never trade randomly in the middle of nowhere.
Regime
Zero Gamma tells you HOW to trade: fade the edges (positive) or ride the momentum (negative).
Confirmation
Order flow and footprint tell you WHO WON the battle at the line before risking your capital.

Daily Pre-Session Checklist
Put Institutional Gamma on Your Charts Today
Stop guessing where institutions are hedging. The Gamma Wall commercial indicator streams live, real-time 0DTE options gamma levels directly onto your NinjaTrader 8 charts.